RECENT POSTS

Loneliness And Race In The Twilight Years

Courtesy of Pablo Benavente

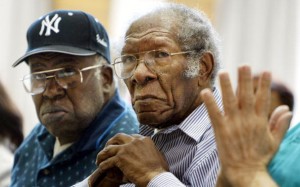
The quality of life for the elderly varies by race, and a new report from the Council on Contemporary Families sheds light on how loneliness affects seniors.

The report, by the nonprofit, non-partisan group based at University of Miami, found that elderly women are more likely to live alone and face higher poverty rates than men. But poverty is even higher for black and Hispanic women. Elderly black women are more likely to be widows because black men don’t live as long as white men. The average white man lives seven years longer than the average black man.

Older white men are better off financially than any other elderly group, but suicide is most prevalent for the widowed among them, according to the report. The suicide rate for white men over 80 is six times the overall average in the U.S., and three times the rate for black men of the same age.

Blacks and Latinos have a tougher time financially during retirement than whites for a number of reasons. For instance, poverty is more prevalent among elderly people of color, who are less likely to have workplace retirement plans than whites.

The elderly population in D.C. is majority black, but whites 75 and older in the city are more likely to live alone, according to census estimates:

Total households with someone 75+ One-person, 75+ households Percentage of one-person, 75+ households
Black 17,337 7,979 46%
White 7,590 4,549 60%
Hispanic 859 373 43%
 *Source: 2010 U.S. Census Bureau estimates

Some other take-aways from the report: women over 60 who live alone are happier than married women of the same age, and older, solitary men have more trouble maintaining social networks than women living alone.

Lost In Translation: Report Says D.C. Struggles To Serve Non-English Speakers

Seth Anderson / Flickr

D.C.’s non-English speakers have the right to interpretation or translation services when accessing services through the city, whether it’s requesting a housing inspector or getting food stamps. But a report released Thursday shows that many non-English speakers in the District experience major difficulties getting services in their native languages.

The report [PDF] was released by the DC Language Access Coalition and American University’s Washington College of Law. (Disclosure: WAMU 88.5 is licensed to American University).

DCLAC surveyed 258 people and found that Chinese and Vietnamese speakers had the most difficulty interacting with D.C. entities. Overall, 58 percent of people had some language access problem, such as not being able to get an interpreter or translated documents.

According to D.C.’s Language Access Act of 2004, D.C. agencies have to offer oral interpretation for all languages, and translate important documents into languages spoken by at least three percent of people needing services.

The DCLAC report includes stories from Amharic speakers who had trouble getting food stamps for their children and Spanish speakers who couldn’t communicate with housing inspectors. Nearly 14 percent of D.C. residents are immigrants, most of whom hail from Latin America.

Continue reading

Unmarried And Same-Sex Couples More Likely To Be Interracial

Captured_by_Becca / Flickr

Interracial relationships are more common among unmarried couples than people who are married, according to census data released Wednesday.

The numbers show that D.C. is above national rates when it comes to interracial marriage and dating. Another stand-out point: interracial coupling is more prevalent among same-sex partners than opposite-sex partners in D.C. Check out the numbers below:
Continue reading

In Your Words: Who Are The Native Washingtonians?

Mad African!: (Broken Sword) / Flickr

Most of D.C.’s newcomers hail from far-away locales rather than Washington’s suburbs, according to recent census estimates. Given that, I asked last week whether someone like me, raised in Maryland but now living in D.C., gets to claim any native Washingtonian status — a title that carries weight in this transient city. A number of you chimed in, both in our comments section and on Twitter. Continue reading

Who Can Claim ‘Native Washingtonian’ Status?

Mr. T in DC / Flickr

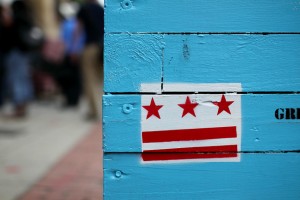
A D.C. flag painted on a planter on gentrified H Street NE.

Most newcomers to D.C. hail from from far-away places, not nearby suburbs, according to newly-released census estimates. More than double the number of people who moved into D.C. from Maryland and Virginia came from outside the region, such as New York and California.

While the nation has seen its population increase because of the rise of racial minorities, D.C.’s population has grown because of whites moving into the city. At the same time, the District’s black community has shrunk. And those leaving D.C. mostly move to places like Maryland’s Prince George’s and Montgomery counties, according to the census estimates.

All of these numbers makes me wonder about what it means to be a “native Washingtonian.” It’s a term that carries plenty of clout in this transient city, and especially in light of gentrification, it’s become code for “non-gentrifier.” But as the city swells with folks who hail from so far away, could local newcomers claim some of that clout, too? Take me, for example: I was born in D.C. and grew up in Maryland. I moved into the District a few years ago, but D.C. news, arts and politics have been a big part of my adult life. At the same time, I acknowledge that my childhood was marked more by rolling, rural hills than by city streets. Am I no different than someone who moved from, say, the Midwest?

Anyway, check out the full list of places from where D.C. newcomers hail and click through our map of movement throughout the D.C. region:

Continue reading

Why Retirement is Tougher for Blacks, Latinos

Mario Tama / Getty Images

Senior citizens attend a meeting with their senator about Social Security at the Isabella Geriatric Center in New York City. Black seniors, on average, rely more heavily on Social Security than whites.

Unemployment rates are higher for blacks and Latinos than for whites, but there’s another disparity at the end of the career spectrum: retirement. Black and Latino retirees have a tougher time financially than their white counterparts, according to a new University of California, Berkeley study [PDF]. Below are three reasons why:

Poverty is higher among black and Latino seniors than white seniors.

The poverty rate among all seniors is about 9 percent. For white seniors, it’s 7 percent, while for black and Latino seniors, it’s 19 percent. People of color over 60 years old are more likely to live in poverty because they rely on fewer sources of retirement income than white seniors, according to the study’s authors.

Continue reading

Interracial Marriage Rises to All-Time High

K's GLIMPSES / Flickr

White and Asian couples are the most common pairing of interracial marriages in D.C.

The share of marriages that were interracial reached an all-time high in 2010. A Pew Research Center study released Thursday found that 8.4 percent of married couples were interracial or inter-ethnic, a record number, and 15.1 percent of people who got married in 2010 did so across racial lines.

But the trends aren’t the same for every racial group. Whites were the least likely to marry someone of another race in 2010, while Asians were the most likely to.

The Pew study also found that more than four-in-10 Americans say the rise in interracial marriages has been a good change in society. We’ve previously explored how tolerant D.C. is of interracial couples, and a number of you shared your experiences, both positive and negative. Almost 20 percent of new marriages from 2008 to 2010 in D.C. were interracial. White-black couples are the least prevalent of interracial marriages in D.C., while the District ranks as the “state” with the second highest percentage of white-Asian marriages  (Hawaii ranks first).

Here’s the breakdown for D.C.’s newly-wed couples between 2008 and 2010:
Continue reading

In Your Words: Black or African American?

Leo Reynolds / Flickr

Last week we wrote about the ongoing debate over whether “black” or “African American” is the preferred term among black Americans born in the United States. A 2011 The Wall Street Journal/NBC poll showed that 42 percent of respondents preferred to be called black, compared to 35 percent who went by African American and 13 percent who said it didn’t matter.

We noted some complexities within this debate — what about African immigrants, non-black Africans and second-generation Americans with roots in Africa? A number of you with similar backgrounds chimed in to offer thoughts on what you preferred to be called, and how you’ve navigated racial identity in America.

Commenter Frenchie wrote she prefers to be called “Haitian-American:”

I prefer not to be called African-American because it doesn’t  correctly encompass my history or background. Additionally, there  continue to be tensions between “member of the African diaspora, “exotic” blacks  and African-Americans  “regular” blacks. That often painful and tense history continues to prevent black immigrants from feeling as if African-American can ever be an all-inclusive term and, thus, makes “black” our default.

Some readers were unsure of what to call themselves, such as commenter Cia0912:

Continue reading

Black or African American?

Paul J. Richards / AFP/Getty Images

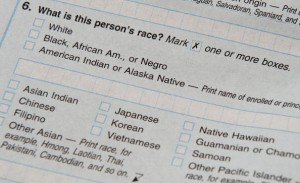
The 2010 Census form had one option for "black, African American or Negro."

What do you say: “black” or “African American?” As someone who regularly writes about race and demographics, I often find myself using both terms interchangeably. But there is no clear on consensus on which term is most accurate or preferred, as Associated Press reporter Jesse Washington writes in a story this week on the debate.

Washington notes that the term “African American,” which came from the black intelligentsia, became popularized after the Rev. Jesse Jackson used it in the 1980s. Jackson told reporters at the time: “Every ethnic group in this country has a reference to some land base, some historical, cultural base. African-Americans have hit that level of cultural maturity.”

But not everyone today prefers to be called African American. According to a January 2011 The Wall Street Journal/NBC poll [PDF], 42 percent of respondents said they preferred to be called black, compared to 35 percent who preferred African American (13 percent said it didn’t matter). From Washington’s story:

Continue reading

Mapping Local Poverty Trends Over Time

Most of the D.C.-metro area’s poor live in the suburbs, but the city is home to nearly all of the region’s “dangerously high-poverty” neighborhoods. That’s according to the Urban Institute, which developed this interactive map (seen below) showing concentrations of poverty by race throughout the region. Neighborhoods where poverty rates are 30 percent or higher are considered “high-poverty.”

Poor whites and Latinos are more likely to live in the D.C.’s suburbs than poor blacks. The researchers note:

High-poverty neighborhoods — like those east of the Anacostia River in DC — didn’t occur “naturally” nor do they reflect the “choices” of poor families about where to live. Instead, these places represent the legacy of decades of racial discrimination, legally sanctioned segregation, and public housing policies. And our map shows just how stubborn this legacy is; despite dramatic demographic and economic changes sweeping the Washington region over the past two decades, poor Black families have remained highly concentrated in DC neighborhoods east of the Anacostia River.

You can zoom in to see poverty in the region or in the city, and use the slider to see how it changes over time:

Continue reading