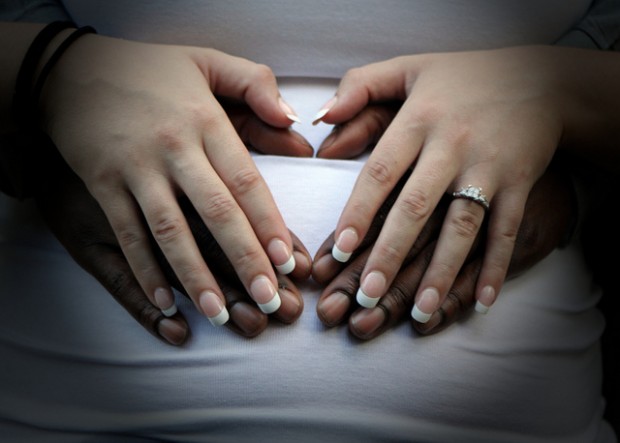
The numbers show that D.C. is above national rates when it comes to interracial marriage and dating. Another stand-out point: interracial coupling is more prevalent among same-sex partners than opposite-sex partners in D.C. Check out the numbers below:
Continue reading
Census
RECENT POSTS
How D.C. Changed in 2011
Elvert Barnes / Flickr
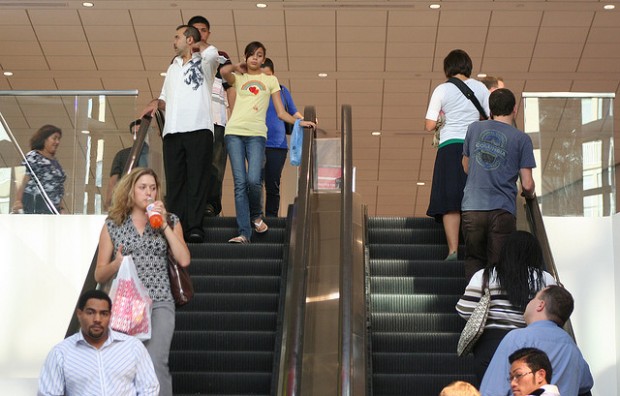
A diverse group of people ride up and down escalators at DC USA in Columbia Heights. D.C. experienced dramatic demographic changes in 2011.
The year is nearly coming to a close, so we thought we’d take a look back to see just how much D.C. changed in 2011. Here’s our list, and feel free to contribute more in the comments section:
Five Facts About Race, Poverty and Health Insurance
Poverty rates have reached their highest levels since 1993, with 1 in 6 Americans living in poverty in 2010, according to new census data released today. But not all groups have been affected equally.
Here’s what we’ve gleaned from the latest U.S. Census Bureau data dump, which includes information on the racial groups most likely to live in poverty, be without insurance or see drops in household income:
Who had the lowest poverty rate? Whites.
White people had the lowest poverty rate in 2010, at 9.9 percent. The percentage of whites living in poverty didn’t change much between 2009 and 2010, but household income did drop slightly.
Which group is hit hardest by poverty? African Americans.
We know the black middle class was particularly hit hard by the recession, but it’s not just the middle class that’s feeling disproportionate effects. More than a quarter of African Americans live in poverty, and the rate is rising faster than that of any other group.
Which group saw the biggest increase in the uninsured? Asians.
The percentage of Asians without health insurance increased to 18.1 percent, while it remained relatively stable for whites, blacks and Hispanics. However, Hispanics are still the most likely to be without insurance; nearly 1 in 3 don’t have coverage.
Are naturalized citizens less likely to live in poverty? Yes.
The poverty rate for immigrants who have become U.S. citizens is 11.3 percent. But that rate is more than double for the foreign-born who haven’t become citizens.
Who has the largest household income? Asians.
Households headed by an Asian had the largest median income in 2010, at $64,308, which is more than double the amount for African Americans. The median household income for whites was $54,620 in 2010. Measuring median income gives a more accurate picture of the state of a particular community because it controls for the very poor and the very rich — so people like Oprah and Bill Gates can’t skew the picture.
D.C.’s Central American Population Increases
Mandel Ngan / AFP/Getty Images
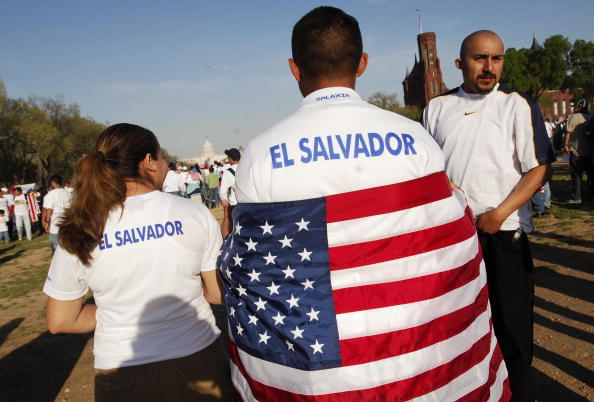
A protestor with a t-shirt bearing the name of the country "El Salvador" drapes a US flag over his shoulders during an immigration rally on the National Mall.
An increase in the number of Central Americans accounts for much of the rise of Hispanics in D.C., according to newly released Census data.
There were 7,557 more Central Americans in D.C. in 2010 than in 2000. Hispanics of all races constituted 9.1 percent of the District’s population in 2010, a jump from 7.9 percent in 2000. Meanwhile, the District’s non-Hispanic black population has been slowly declining over the past decade, with most estimates putting it at below 50 percent, the first time D.C. has been without a black majority in more than 51 years.
D.C. Population Changes by Block
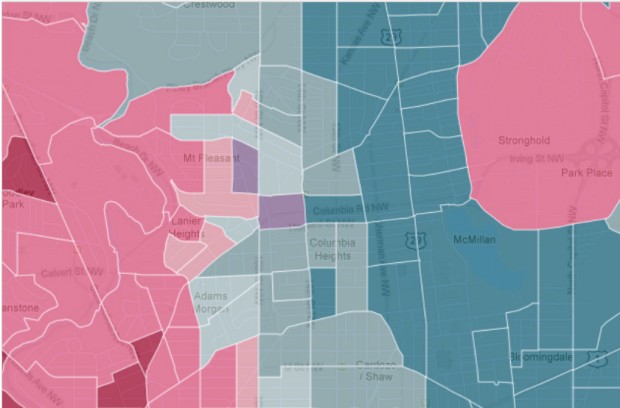
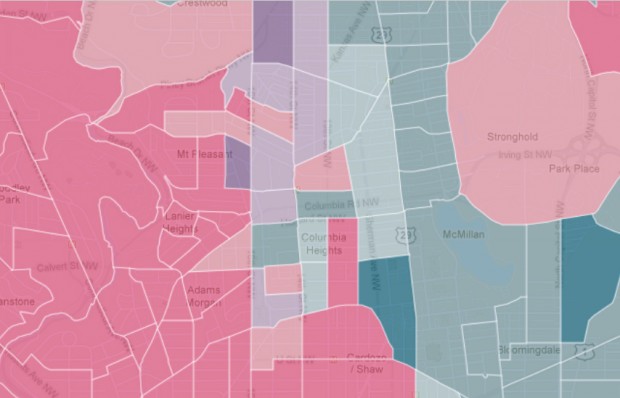
There’s nothing like a color coded map to help you understand D.C.’s demographic changes. The Washington Post‘s interactive Census map details the density of racial groups by blocks throughout D.C.-metro area. After zooming in on the District, it appears some of the most dramatic changes over the past 30 years occurred in Shaw, Columbia Heights and Petworth.
The blocks just north of the U Street corridor used to be 77 percent black and 5 percent white; now, they’re 15 percent black and 66 percent white. Columbia Heights blocks that once had a black majorities are now mostly Hispanic. Blocks between Georgia and Sherman avenues were majority black in 1990 and still are — although to a much lesser degree.
The maps below show which racial groups constitute the majority in a block area. Bolder colors represent higher percentages of that group:
1990
Screenshot / Washington Post
Population breakdown in Adams Morgan, Columbia Heights, Shaw and Petworth in 1990. (White = Pink; African Americans = Blue; Hispanics = Purple)
2010
Screenshot / Washington Post
Population breakdown in Adams Morgan, Columbia Heights, Shaw and Petworth in 2010. (White = Pink; African Americans = Blue; Hispanics = Purple)
Examining Class Disparities in D.C.’s Growing Indian Population
The Asian American population in the D.C.-area increased dramatically over the past decade, The Washington Post reports:
Indians are the latest wave of Asians transforming the region, having leapfrogged over Koreans a decade ago. For the first time, they make up the biggest group of Asians in Virginia, largely because they have moved to the Washington suburbs.
Their increasing presence reflects the growth of information-technology jobs in the region. Most came for jobs, having attended school elsewhere in the United States or in India, said Qian Cai, head of demographics at the University of Virginia’s Weldon Cooper Center for Public Service.
With their high levels of education and income, Indians are pushing up those averages for the entire region.
“The ability to attract the Asian Indian community here helps to increase the knowledge base of our metro area,” said William H. Frey, a demographer at the Brookings Institution. “These are the cream of the crop, in terms of people who have high skills. Their kids are going to our schools and improving the schools in the process.”
While many Asians in the D.C.-area have high levels of education and income, and particularly those settling in wealthier counties such as Loudoun and Fairfax in Virginia, there are Asian Americans who don’t fit the mold.
U.S. Population Growth Minority-Driven, But Not in D.C.
DCentric sister blog Multi-American directs our attention to the Pew Center’s Daily Number feature for today that shows the country’s population growth between 2000 and 2010 was almost exclusively driven by minorities:
Overall, racial and ethnic minorities accounted for 91.7% of the nation’s population growth over the past 10 years.
The non-Hispanic white population has accounted for only the remaining 8.3% of the nation’s growth. Hispanics were responsible for 56% of the nation’s population growth over the past decade. There are now 50.5 million Latinos living in the U.S. according to the 2010 Census, up from 35.3 million in 2000, making Latinos the nation’s largest minority group and 16.3% of the total population. There are 196.8 million whites in the U.S. (accounting for 63.7% of the total population), 37.7 million blacks (12.2%) and 14.5 million Asians (4.7%). Six million non-Hispanics, or 1.9% of the U.S. population, checked more than one race.
That certainly isn’t the case here in D.C., where population growth was driven by non-Hispanic whites. Between 2000 and 2010, the black population declined and the Hispanic population rose from just 7.9 percent of the city’s population 9 percent. But we can look to the surrounding suburban counties to see a more representative picture of what’s happening across the country.
Immigrants: D.C’s Other Black Residents
There’s much to be discussed about today’s Washington Post story on the meaning of D.C.’s changing demographics. But aside from the heated comments on gentrification — which even spurred a bingo card – comes this comment on the actual story, from poster gardyloo:
What stories on the census don’t discuss is how many of the 300,000 Washingtonians identify as African Americans because they are immigrants from Africa, or children of immigrants from Africa. That number is probably as high as ten percent of the overall total of African Americans here now. Their story is, for the most part, the immigrant story, the story of a search for opportunity and a better life. They aren’t weighed down by the city’s history and golden-age thinking.
We’re not sure exactly where those particular figures come from (perhaps they refer to the African population in the entire D.C.-metro area, which numbers as 150,000 strong). But if we look at the most recent Census estimates, the District had about 74,000 foreign born residents in 2009. Of those, about 18,000 are black immigrants from African and Caribbean countries — accounting for 24 percent of all immigrants here in the District. Those numbers obviously don’t include the U.S.-born children of these immigrants, but they do speak to a sizable population of folks in D.C. who may check “black or African-American” on a Census form but perhaps don’t identify first and foremost with the American black experience.
When Part-Latino Men are Considered ‘White Dudes’
In responding to a Wall Street Journal story about how white children are now the minority in many states as the number of Hispanic children grows, D.C.’s Matthew Yglesias writes:
I think this is a widely misreported trend. When the New York Times recently did a piece on me, Ezra Klein, Brian Beutler, and Dave Weigel exactly zero people complained about the massive over-representation of people of Latin American ancestry that reflected. People saw it as a profile of four white dudes. Which is what it was. But my dad’s family is from Cuba, Ezra’s dad’s family is from Brazil, and Brian’s mom’s family is from Chile. That’s kind of a funny coincidence, but the combination of continued immigration and intermarriage means that over time a larger and larger share of American people will be partially descended from Latin American countries.
That Times piece on Yglesias and his fellow, young pundits did receive plenty of criticism (and even its own parody!). But Yglesias is right: no one criticized the over-representation of Latin American-ancestry among the four subjects. The reporter behind the piece even commented on the “white maleness” of the story.
When it comes to Latinos and Hispanics, racial identity has proven to be a much more fluid thing than for other groups. For instance, let’s take a look at Latino immigrants: a 2010 American Sociological Association report found that there are many Latino immigrants who are accepted as white by larger society, but those with darker complexions still face plenty of discrimination. It even suggested a new racial category to describe Latinos could form.
D.C. Census: Our multiracial residents
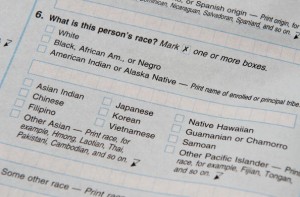
Much has been made of D.C.’s losing its Chocolate City status, but as one person rightly pointed out, the 2010 U.S. Census Bureau statistic of D.C.’s black population being 50.7 percent doesn’t include people who checked black and another race.
Nationwide there has been a significant increase — almost 50 percent among children — of people reporting multiple races in the 2010 Census. But how big of a jump was there in D.C., and how do multiracial residents fit into the District’s changing image of a majority-black city?
A look at the numbers leads us to believe this population isn’t making that much of an impact in a debate that’s largely white-black: in 2010, 17,316 people, or 2.9 percent of the District’s population, reported being of two or more races. That’s an increase from 2.4 percent in 2000. Not a phenomenal boost, no, but it is growing slightly.
In 2010, the largest number of multiracial residents were white and Asian (3,736), followed closely by people reporting to be white and black (3,476). But the number of people reporting to be black and any other race was 7,436. Are those folks part of Chocolate City? If so, the statistical contribution would be a small one, said demographer Roderick J. Harrison, a senior fellow at the Joint Center and a Howard University associate professor. D.C. lost 39,000 black residents since 2000.
President Barack Obama most likely checked both the white and black boxes under race on his Census form. And yet many refer to President Obama as America’s first black president. Seldom do we hear “first biracial president.” The legacy behind that is a long one indeed, but there are also individuals who, while acknowledging their multiracial backgrounds, more closely identify with one over the other.
Continue reading

