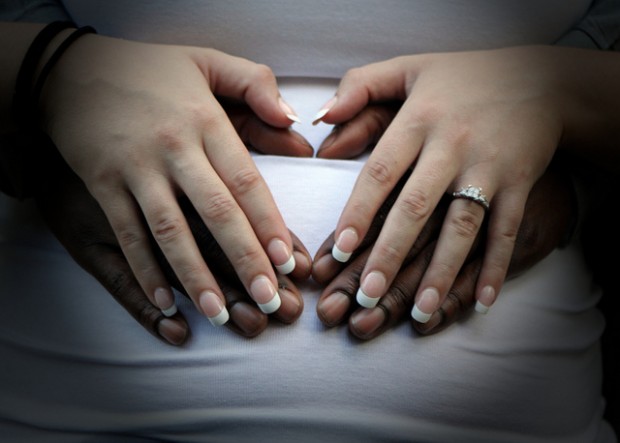
The numbers show that D.C. is above national rates when it comes to interracial marriage and dating. Another stand-out point: interracial coupling is more prevalent among same-sex partners than opposite-sex partners in D.C. Check out the numbers below:
Continue reading
Demographics
RECENT POSTS
In Your Words: Who Are The Native Washingtonians?
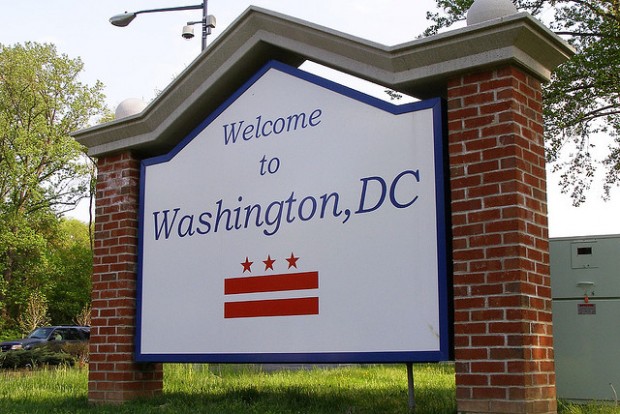
Mad African!: (Broken Sword) / Flickr
Most of D.C.’s newcomers hail from far-away locales rather than Washington’s suburbs, according to recent census estimates. Given that, I asked last week whether someone like me, raised in Maryland but now living in D.C., gets to claim any native Washingtonian status — a title that carries weight in this transient city. A number of you chimed in, both in our comments section and on Twitter. Continue reading
Who Can Claim ‘Native Washingtonian’ Status?
Mr. T in DC / Flickr
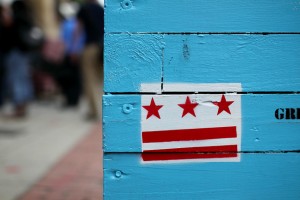
A D.C. flag painted on a planter on gentrified H Street NE.
Most newcomers to D.C. hail from from far-away places, not nearby suburbs, according to newly-released census estimates. More than double the number of people who moved into D.C. from Maryland and Virginia came from outside the region, such as New York and California.
While the nation has seen its population increase because of the rise of racial minorities, D.C.’s population has grown because of whites moving into the city. At the same time, the District’s black community has shrunk. And those leaving D.C. mostly move to places like Maryland’s Prince George’s and Montgomery counties, according to the census estimates.
All of these numbers makes me wonder about what it means to be a “native Washingtonian.” It’s a term that carries plenty of clout in this transient city, and especially in light of gentrification, it’s become code for “non-gentrifier.” But as the city swells with folks who hail from so far away, could local newcomers claim some of that clout, too? Take me, for example: I was born in D.C. and grew up in Maryland. I moved into the District a few years ago, but D.C. news, arts and politics have been a big part of my adult life. At the same time, I acknowledge that my childhood was marked more by rolling, rural hills than by city streets. Am I no different than someone who moved from, say, the Midwest?
Anyway, check out the full list of places from where D.C. newcomers hail and click through our map of movement throughout the D.C. region:
D.C. Population Changes by Block
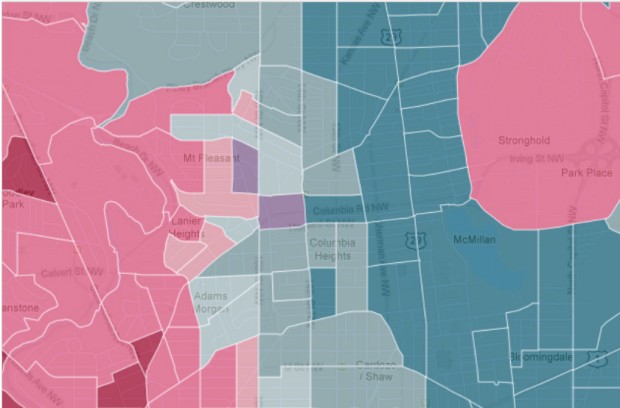
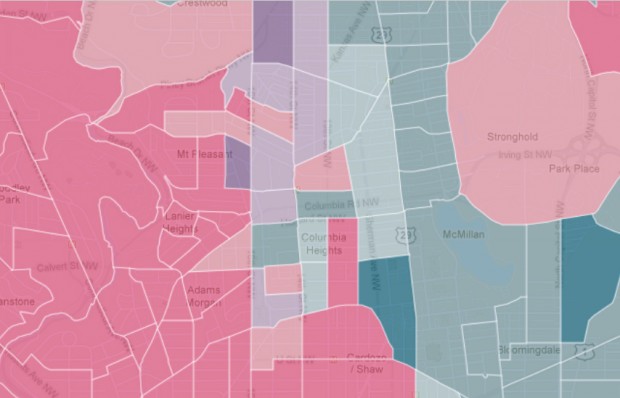
There’s nothing like a color coded map to help you understand D.C.’s demographic changes. The Washington Post‘s interactive Census map details the density of racial groups by blocks throughout D.C.-metro area. After zooming in on the District, it appears some of the most dramatic changes over the past 30 years occurred in Shaw, Columbia Heights and Petworth.
The blocks just north of the U Street corridor used to be 77 percent black and 5 percent white; now, they’re 15 percent black and 66 percent white. Columbia Heights blocks that once had a black majorities are now mostly Hispanic. Blocks between Georgia and Sherman avenues were majority black in 1990 and still are — although to a much lesser degree.
The maps below show which racial groups constitute the majority in a block area. Bolder colors represent higher percentages of that group:
1990
Screenshot / Washington Post
Population breakdown in Adams Morgan, Columbia Heights, Shaw and Petworth in 1990. (White = Pink; African Americans = Blue; Hispanics = Purple)
2010
Screenshot / Washington Post
Population breakdown in Adams Morgan, Columbia Heights, Shaw and Petworth in 2010. (White = Pink; African Americans = Blue; Hispanics = Purple)
Which D.C. Ward Has The ‘Ideal’ Racial Make-Up?
Lamenting over D.C.’s changing mix of residents (read: more white people, less black people) have raised some questions: isn’t this just increased diversity? And isn’t that supposed to be a good thing?
Courtland Milloy included this interesting point in a Tuesday column:
“Surveys show that when asked, blacks, on average, say the ‘ideal’ neighborhood racial composition would be about 30 to 35 percent black,” said Roderick J. Harrison, an associate professor of sociology and anthropology at Howard University.
Why? Because blacks derive significant benefits from living among middle-class white people, such as better city services, better schools and higher-quality stores.
Moreover, 30 percent is large enough for blacks to create a comfort zone that blunts the effects of white prejudice but small enough not to trigger white flight.
A 2009 study by researchers at New York University noted that “the strongest predictor of resistance to racial integration among whites is prejudice, whereas the strongest predictor of black avoidance of white neighborhoods is fear of discrimination.”
Flickr: Bill McNeal
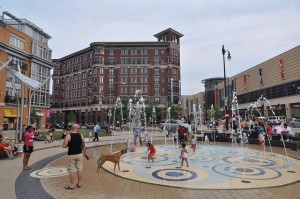
Ward 1, which includes neighborhoods such as Columbia Heights, is D.C.'s most racially diverse area.
So which D.C. neighborhoods most reflect this “ideal mix?” It seems Ward 1 comes closest; although no one group maintains a majority there, 40.8 percent of residents are white, 31.5 percent are black and 20.8 percent are Hispanic or Latino. As for the socioeconomic makeup of the ward, 41 percent of households make $75,000 or more a year; 28 percent make $35,000 to $74,999 a year; and 31 percent make below $34,999.
But you still have to live in the neighborhood in order to derive the benefits that more whites and richer people bring. Nordlie1, a commenter on a DCentric post explaining why so many black residents have left D.C., writes:
“Losing a majority (of black folks) ” “More diverse (white folks)” = (politically correct:) gentrification. All the same. Bad thing when it displaces poor black people.

