2010 Census

RECENT POSTS

Poverty By Race in D.C.

Sharon Drummond / Flickr

The District’s poverty rate — 19.9 percent — is the third highest in the nation. But the way that rate breaks down by race shows that not all groups are affected equally by poverty.

These figures come courtesy of the U.S. Census Bureau, which recently released its American Community Survey 2010 estimates for poverty and race. (Keep in mind the figures have various margins of error.):

Poverty Rate Median Income
White  8.5% $99,220
Hispanic 14.7% $60,798
Asian 20.1% $77,098
Black 27.1% $37,430
 *American Community Survey 2010 Estimates

Kathryn Baer of Poverty and Policy also points out that the percentage of D.C.’s children living in poverty has risen to 30.4 percent, the second-highest childhood poverty rate in the country. Baer writes:

In short, these are mostly grim figures — and a far cry from the “one city” Mayor Gray envisions.

To my mind, the child poverty rate rings the loudest alarm bells because we’ve got volumes of research showing that children who live in poverty have much higher risks of poor health, developmental delays, academic difficulties and other problems;

These, the research shows, pave the way for lifelong poverty — and thus another generation of children who are born with two strikes against them.

Why D.C.’s Latino Population is Up When It’s Black Population is Down

Cameron Nordholm / Flickr

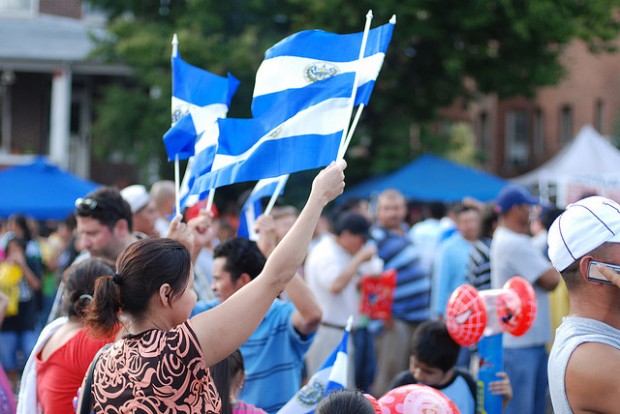
A woman waves the Salvadoran flag during Fiesta DC in Mount Pleasant, one of D.C.'s longtime Latino centers.

Columbia Heights and Mount Pleasant, traditionally the center of the D.C.’s Latino community, are much different places now than they were 20 years ago. Big box stores sit upon formerly vacant lots. Pupuserias now have vegan cafes as neighbors. House values have exploded. Ward 1, where these neighborhoods are located, has lost more than 2,000 Latinos over the past decade.

Travel a few blocks south and you see a similar transformation. The U Street area, formerly “Black Broadway,” was 77 percent black; it’s now only 15 percent black. Many longtime residents who had bought homes at modest prices have sold them for large sums. Others were priced out by rising rents. Luxury high-rise condo buildings have sprouted up.

But while the number of African Americans throughout D.C. is declining — by 11 percent over the past decade –the number of Latinos actually increased, by about 21 percent. This growth happened despite the fact that rapidly increasing housing prices have particularly affected longtime Latino neighborhoods, according to the District’s 2009 State of Latinos report.

So why is D.C.’s Latino community growing while it’s black community shrinks?

Continue reading

Census 2010: Segregation in D.C.

Can’t get enough of the latest 2010 U.S. Census Bureau statistics? Us neither. Salon.com has a slide show out today showing the country’s most segregated large metropolitan areas, which led us to ask: where does D.C. rank on that list? The short answer: No. 38.

Now, for the longer answer: the ranking from the Population Studies Center at the University of Michigan measures white-black segregation for the entire D.C.-metro area, which in this case includes large swaths of Northern Virginia, Maryland and West Virginia, an area totaling nearly 5.6 million people. And those suburbs have a lot of people — Montgomery County alone has nearly 1 million residents, which outnumbers the District’s approximate 600,000 residents. And some of those suburbs are more thoroughly integrated than the District, where the 2010 Census data shows that Wards 7 and 8 are largely black and Wards 2 and 3 maintain white majorities.

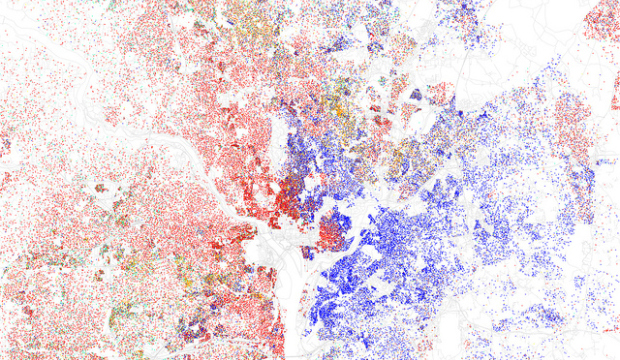
Take a look at Eric Fischer’s updated racial and ethnic distribution maps and you will see that by-and-large, there remains stark segregation between white and black residents in D.C., meanwhile there are many areas with strong integration patterns in the outlying suburban counties.

D.C. Census map

Flickr: Eric Fischer

Map of racial and ethnic divisions in US cities, inspired by Bill Rankin's map of Chicago, updated for Census 2010. Red dots represents whites, blue represents blacks, green represents Asian, orange represents Hispanics and Latinos and yellow represents some other race. Each dot is 25 residents. Data from Census 2010. Base map © OpenStreetMap, CC-BY-SA.

The Population Studies Center compiled data that is used to determine just how segregated our country’s major metropolitan areas are, places with populations exceeding 500,000. The ranking — a dissimilarity index — ranges from zero, complete integration, through 100, complete segregation. What the ranking really measures is the percentage of people of one race who would have to move in order to create a more even distribution.

Now, for some good news: the D.C.-metro area has less white-black segregation now than it did back in 2000, according to the index. But the rate of white-black integration slowed by nearly half between 2000 and 2010 when compared to the previous decade.

Check out the white-black segregation rankings for the country’s 108 largest metropolitan areas:

Continue reading

D.C. Census: Black population down, white population up

The much-awaited 2010 U.S. Census Bureau data has finally been officially released to the public and yes, all of the predictions that D.C. would just barely remain a majority-black city turned out to be true (no surprises here).

According to the data, 50.7 percent of District residents are black, 38.5 percent are white, 9.1 percent identify as Latino or Hispanic, 3.5 percent are Asian, 4.1 percent identify as some other race, and 2.9 percent are of two or more races. Take note of the nifty Census map below to see how big of a change we’ve seen in just the past 10 years: the white population increased by 31.4 percent while the black population decreased by 11.1 percent. But we’re still Chocolate City — just barely.