Census 2010: Segregation in D.C.
Can’t get enough of the latest 2010 U.S. Census Bureau statistics? Us neither. Salon.com has a slide show out today showing the country’s most segregated large metropolitan areas, which led us to ask: where does D.C. rank on that list? The short answer: No. 38.
Now, for the longer answer: the ranking from the Population Studies Center at the University of Michigan measures white-black segregation for the entire D.C.-metro area, which in this case includes large swaths of Northern Virginia, Maryland and West Virginia, an area totaling nearly 5.6 million people. And those suburbs have a lot of people — Montgomery County alone has nearly 1 million residents, which outnumbers the District’s approximate 600,000 residents. And some of those suburbs are more thoroughly integrated than the District, where the 2010 Census data shows that Wards 7 and 8 are largely black and Wards 2 and 3 maintain white majorities.
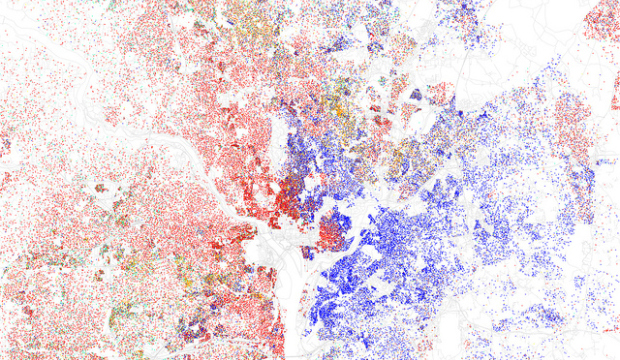
Take a look at Eric Fischer’s updated racial and ethnic distribution maps and you will see that by-and-large, there remains stark segregation between white and black residents in D.C., meanwhile there are many areas with strong integration patterns in the outlying suburban counties.

Flickr: Eric Fischer
Map of racial and ethnic divisions in US cities, inspired by Bill Rankin's map of Chicago, updated for Census 2010. Red dots represents whites, blue represents blacks, green represents Asian, orange represents Hispanics and Latinos and yellow represents some other race. Each dot is 25 residents. Data from Census 2010. Base map © OpenStreetMap, CC-BY-SA.
The Population Studies Center compiled data that is used to determine just how segregated our country’s major metropolitan areas are, places with populations exceeding 500,000. The ranking — a dissimilarity index — ranges from zero, complete integration, through 100, complete segregation. What the ranking really measures is the percentage of people of one race who would have to move in order to create a more even distribution.
Now, for some good news: the D.C.-metro area has less white-black segregation now than it did back in 2000, according to the index. But the rate of white-black integration slowed by nearly half between 2000 and 2010 when compared to the previous decade.
Check out the white-black segregation rankings for the country’s 108 largest metropolitan areas:


