A rise in Hispanic and Asian neighbors has changed the racial makeup of neighborhoods where the average black person lives, Margery Turner of think tank Urban Institute writes. Meanwhile, the percentage of white people in these neighborhoods hasn’t changed that much over the past 30 years, Turner notes. Take a look at these charts showing the racial breakdown of neighborhoods where the average black person lived in 1980 and today.
Continue reading
Segregation
RECENT POSTS
The Disappearing Segregated City
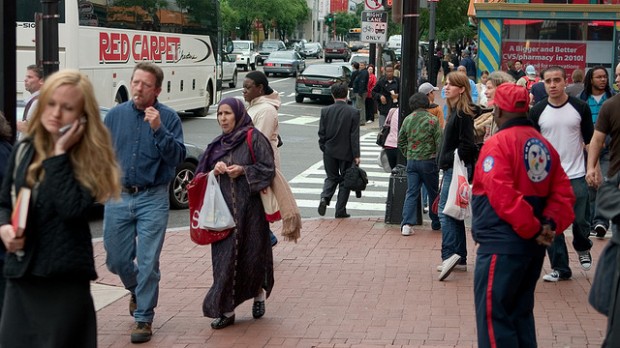
Patrick Calder / Flickr
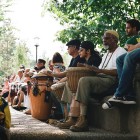
Chinatown D.C. attracts a diversity of people.
Racial segregation in American cities, including in D.C., is on the decline, but it still exists. The D.C. region is the sixth most segregated large metro area, according to a new study by the Manhattan Institute, a conservative think tank. Racial segregation in the D.C. region has been dropping since 2000, but at a slower pace than eight of the nine other cities on the list.
All-white urban neighborhoods have been nearly eradicated in the past few decades, according to the study’s authors, who examined census data from 1890 through 2010. Very few all-white neighborhoods exist today, and they’re mostly in rural areas or cities with a very small black population. In 1970, one-fifth of urban neighborhoods didn’t have a single black resident.
Affluent Minorities Live in Poorer Neighborhoods than White Counterparts
Cynthia Closkey / Flickr
A class divide doesn’t fully explain racial neighborhood segregation, a new Brown University study finds.
Nationally, affluent blacks and Hispanics live in poorer neighborhoods than where the average low-income white person lives.
The D.C. region bucks the trend somewhat; here, wealthy minorities live in areas with the same, not higher, poverty rates as where poor whites live. The proximity of Prince George’s County may skew the results for the region, the Washington Post reports. The county, which is 65 percent black, is home to high concentration of affluent African Americans:
Blacks and Hispanics… who earned more than $75,000 lived in neighborhoods that were virtually the same as neighborhoods populated by whites earning under $40,000, as measured by average income, poverty rates, education levels, home values and housing vacancies.
“Income, and being successful in class terms, does not necessarily put you in a different kind of neighborhood,” said John Logan, a Brown University sociologist who analyzed census data in his study released Tuesday.
Many in D.C. proper view class, not race, as the District’s biggest divider, but racial segregation is more prevelant in the city than in the region as a whole. And the wealthiest areas in D.C. also have the fewest numbers of African American residents. For example, the black population accounts for only 5 percent of Ward 3, the city’s wealthiest area, where the median income is about $97,000.
Census 2010: Segregation in D.C.
Can’t get enough of the latest 2010 U.S. Census Bureau statistics? Us neither. Salon.com has a slide show out today showing the country’s most segregated large metropolitan areas, which led us to ask: where does D.C. rank on that list? The short answer: No. 38.
Now, for the longer answer: the ranking from the Population Studies Center at the University of Michigan measures white-black segregation for the entire D.C.-metro area, which in this case includes large swaths of Northern Virginia, Maryland and West Virginia, an area totaling nearly 5.6 million people. And those suburbs have a lot of people — Montgomery County alone has nearly 1 million residents, which outnumbers the District’s approximate 600,000 residents. And some of those suburbs are more thoroughly integrated than the District, where the 2010 Census data shows that Wards 7 and 8 are largely black and Wards 2 and 3 maintain white majorities.
Take a look at Eric Fischer’s updated racial and ethnic distribution maps and you will see that by-and-large, there remains stark segregation between white and black residents in D.C., meanwhile there are many areas with strong integration patterns in the outlying suburban counties.
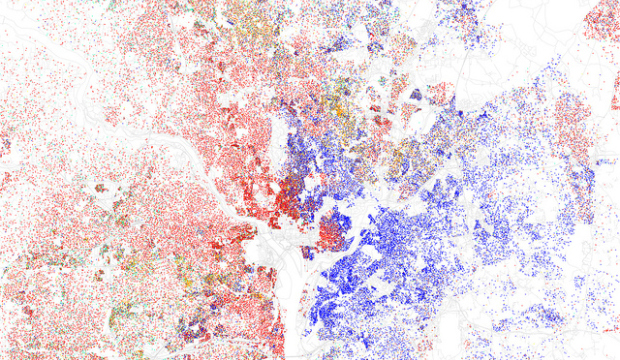
Flickr: Eric Fischer
Map of racial and ethnic divisions in US cities, inspired by Bill Rankin's map of Chicago, updated for Census 2010. Red dots represents whites, blue represents blacks, green represents Asian, orange represents Hispanics and Latinos and yellow represents some other race. Each dot is 25 residents. Data from Census 2010. Base map © OpenStreetMap, CC-BY-SA.
The Population Studies Center compiled data that is used to determine just how segregated our country’s major metropolitan areas are, places with populations exceeding 500,000. The ranking — a dissimilarity index — ranges from zero, complete integration, through 100, complete segregation. What the ranking really measures is the percentage of people of one race who would have to move in order to create a more even distribution.
Now, for some good news: the D.C.-metro area has less white-black segregation now than it did back in 2000, according to the index. But the rate of white-black integration slowed by nearly half between 2000 and 2010 when compared to the previous decade.
Check out the white-black segregation rankings for the country’s 108 largest metropolitan areas:
Emancipation and the Struggle Over Equality in D.C.
Here’s a neat Black History Month event I found via the City Paper. Did I mention that it’s free?
Beginning in 2004, Kate Masur kept stumbling across references to a 19th century Capitol employee and her refusal to leave a train departing from Alexandria…(Masur) eventually identified the employee as Kate Brown. Brown, a women’s room attendant, wanted to sit among the very people she served in the designated “ladies’ car”—implicitly for white women only. After a conductor instructed Brown to move and she refused, he and a police officer police pounded on her knuckles and twisted her arms before tossing her from the car and onto the platform. Masur includes Brown’s story in An Example for All the Land: Emancipation and the Struggle Over Equality in Washington, D.C., an account of black Washingtonians’ efforts to gain equality in the wake of the Civil War…And in a story that will surely resonate with those of us dissatisfied with the District’s Congressional representation—or lack thereof—Masur tells of black and white Washingtonians bonding to cultivate a new Republican Party with big hopes for greater racial equality—only for Congress to abolish the local self-government they needed, all but destroying the progressive foundation they’d established.
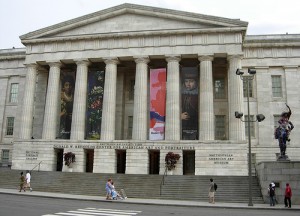
Progressive black and white Washingtonians coming together to create a Republican party for racial equality? I’m there! Well, that and I’m always down to learn more about D.C. history. Tomorrow, Masur will speak at the National Archives (700 Constitution Ave NW). If you miss her there, you have a second chance to hear her– she’ll be at the National Portrait Gallery (800 F Street NW, pictured above) on Wednesday. Both events are at noon. More Black History Month events, here.
It’s never too late.
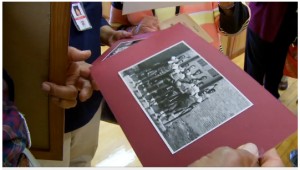
This is wonderful. Fifty years after they graduated from high school, students from two segregated Northern Virginia high schools met for dinner, to get to know each other. For the Class of 1960, Loudoun High School was for White students and Douglass was for Blacks (via WaPo):
Jimmie Roberts, a 1956 graduate married to Peggy, a member of the Class of ’60, delivered a vivid history of Douglass, proudly noting that their daughter, Muriel Roberts Heanue, not only attended Loudoun after it integrated in 1968 but is now an assistant principal there…
Now, as they toured what was once Douglass, they talked about how integration was finally happening for them. At age 68, they are reclaiming some of what segregation took away.
“The friends we would’ve had,” said Sheila Kelly.
“The friends we should’ve had,” said Peggy Roberts.
There’s a video for the story which is worth watching, as well.


